Getting started with NAV
This tutorial will show you how to start monitoring devices with your brand new NAV installation.
The tutorial will refer to the web interface as http://example.org/ - replace this with whatever hostname you have configured for your NAV server.
Minimal configuration
If installing from source, you should have installed a copy of the default set
of NAV configuration files to a global directory, typically /etc/nav/,
as documented in the installation guide. The pre-packaged installation options
should already have done this for you.
Most of the configuration files are documented with comments, so if you want to get advanced you can check each config file to see if there are any defaults you’d like to change.
We recommend you at least change the following options in nav.conf
before running NAV:
- ADMIN_MAIL
Should be set to the NAV administrator’s e-mail address. Any cron mail or other administrative e-mails from NAV will be sent to this address.
- SECRET_KEY
A string of random characters that should be unique to each NAV installation. This is used by the Django framework for cryptographic signing in various situations. Here are three suggestions for generating a suitable string of random characters, depending on what tools you have available:
gpg -a --gen-random 1 51
makepasswd --chars 51
pwgen -s 51 1
Please see the Django secret key documentation if you want to know more about this.
- TIME_ZONE
NAV’s default time zone setting is
Europe/Oslo. You should set this to the appropriate timezone of your location, as NAV will use this for generating and displaying all timestamps. Beware that this should match the configured timezones of your PostgreSQL and Graphite-web installations as well.- DOMAIN_SUFFIX
The DNS domain name your devices are in. Many parts of the web interface will chop off this suffix to display abbreviated device names.
If you installed from source, and did not use a pre-packaged version of NAV,
you will also want to change the directory paths used by NAV to store various
state files, log files and files uploaded through the web interface:
PID_DIR, LOG_DIR and UPLOAD_DIR.
Warning
Before adding stuff to monitor into your NAV, you need to ensure you have properly integrated your Graphite installation with your NAV installation, or you will have issues with blank areas in your graphs, which you will need to resolve manually after-the-fact.
Logging in to the web interface
When browsing the web interface at http://example.org/ you will see the front page of NAV. This is openly accessible to anonymous users by default.
To log in for the first time, click the Login link on the upper right of the page, and enter the username “admin” and the default password “admin”. Then click My stuff and My account in the navigation bar on top and change the adminstrator’s password to something more sensible.
Seeding your database
NAV will not autodiscover the routers and switches of your network. The assumption is that you already have this information in some inventory system.
The Seed Database tool enables to you add and edit a multitude of “seed” information in the NAV database, which tells NAV what and how to monitor. The essential bit here is the IP Device, which represents your switches, routers and other networked devices.
The Seed Database tool is listed on NAV’s Toolbox page, reachable from the navigation bar on top.
Adding your first management profile
To manage IP devices using SNMP, you first need to add at least one SNMP
management profile, to define your SNMP communication parameters. This is done
in the Management Profile tab of SeedDB. Let’s say most of your
devices can be managed using SNMP v2c and a default community string of
public:
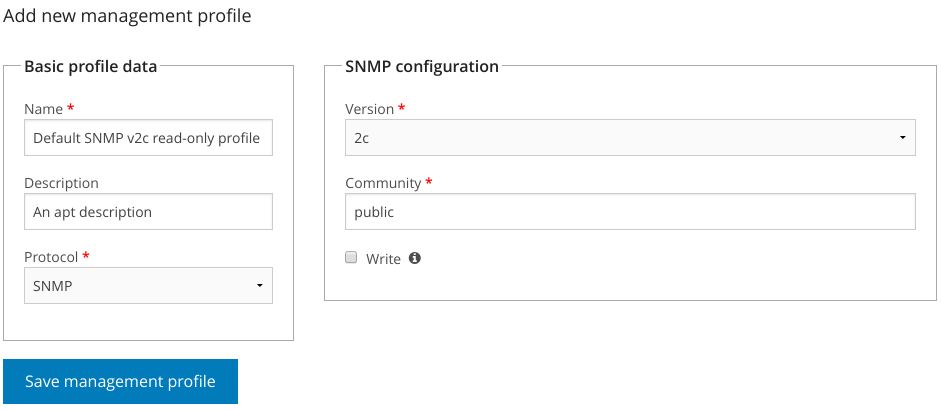
Click the Management Profile tab and then the sub-tab Add new management profile.
Choose and fill out a unique name for your profile, e.g.
Default SNMP v2c
read-only profile
, and optionally add a description of it.Select
SNMPfrom the Protocol dropdown menu. An SNMP Configuration form will appear to the right.Ensure
v2cis selected from the Version dropdown, and putpublicin the Community field.Click the Save management profile button to save your new profile.
NAPALM profiles
NAPALM management profiles can also be created. At the moment, these are only used by PortAdmin to configure switch ports on Juniper switches.
Please see the management profiles reference documentation for more details.
Adding your first device to NAV
Now that you have added your first management profile, you can add your first device that uses this profile. Begin, for example, by adding one of your switches:
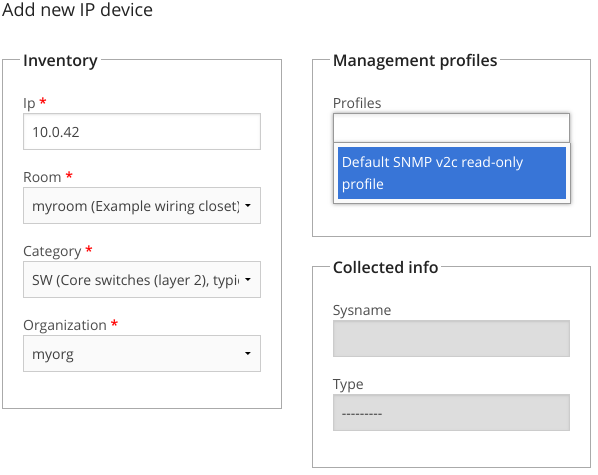
Click the IP device tab and then the sub-tab Add new IP device
Fill out your switch’s IP address in the IP field, and, for now, select myroom and myorg in the room and organization drop-downs.
Select SW in the category dropdown. Don’t worry, we’ll explain the categories later.
Click the Profiles field. The name of your newly created SNMP profile should appear: Select it. The buttow below the profile selector reads Check connectivity. Click this to have NAV verify that it can communicate with this device using the selected profile.
During the connectivity check, NAV will also try to detect the device’s type (from its
sysObjectID value). NAV does not require that the connectivity test is
successful, or even that the test is run, to add the device. But if the test
fails, this means that NAV can not communicate with the device. If that happens,
you should verify that the IP address and the management profile details are correct.
If you want, you can add some free form text about the function of the device in the function field, put the device into one or more relevant groups, and even assign custom attributes to it. These attributes will be used when NAV presents information about the device.
Click on Save IP device to finalize your entry of this device into NAV’s database.
Note
You can, in fact, add multiple management profiles to your devices, but at the moment, this is only useful to distinguish between profiles that will grant read-only SNMP access and profiles that will grant read-write access.
Verifying that collection is working
Within two minutes, NAV’s SNMP collection engine should launch a job to poll your newly added device for information. The navigation bar on top features a search field; search for your newly entered device’s IP address or DNS name to show its IP Device Info page. The resulting page should look something like this:
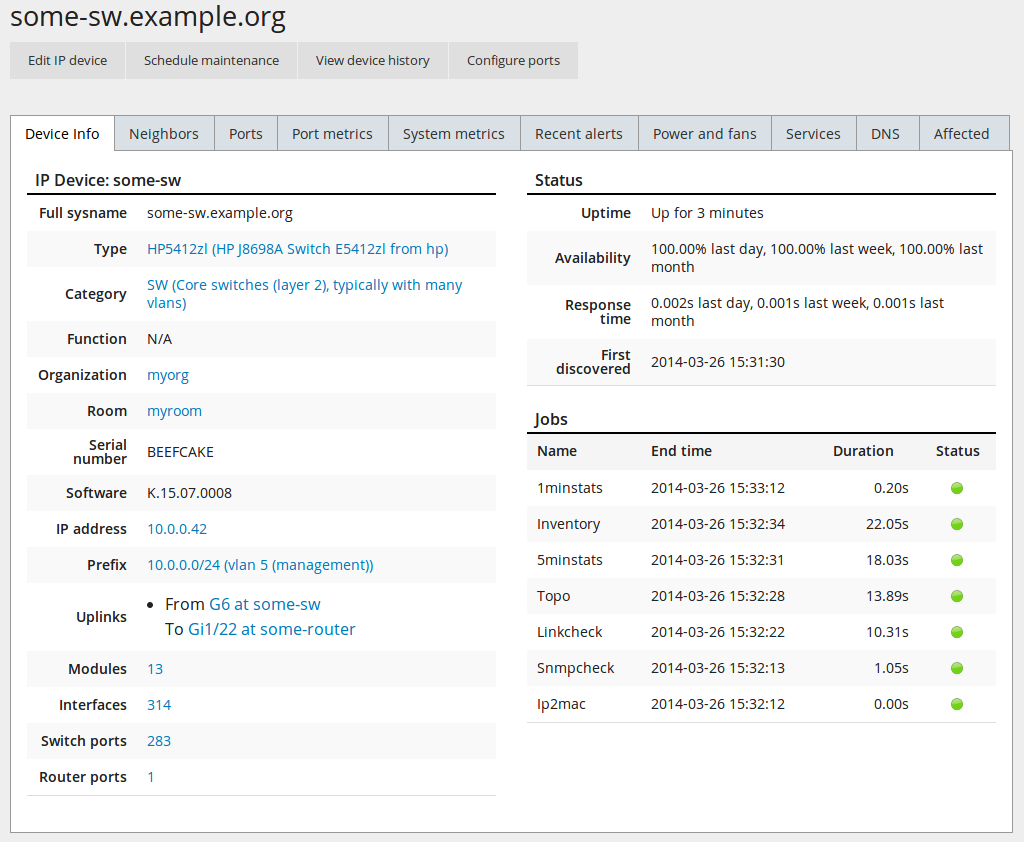
The IP Device Info page will try to display every bit of pertinent
information about a monitored device. For now, the key information here is
the Last updated field of the top-left detail panel. Keep reloading the
page until its value changes from N/A into a meaningful timestamp.
Note
If no new information appears on this page within three minutes after adding your switch to NAV, you may need to start troubleshooting NAV’s log files.
Selecting a device category
When adding an IP device to NAV, you must select one of the predefined device categories:
- GW
Your basic layer 3 router
- GSW
An L3 switch (a routing switch)
- SW
A regular switch
- EDGE
An edge switch. Use this category only if you do not want NAV to collect traffic statistics from its switch ports.
- SRV
A server.
- WLAN
A wireless access point or controller of some sort.
- ENV
An environmental probe, possibly measuring temperatures, humiditiy, etc. If NAV has support for the probe, its measurements will be displayed in the room view for the room the device was registered in.
- POWER
Power distribution and measurement equipment, UPS units and so forth.
- OTHER
Any other type of device not fitting neatly into the other categories.
All categories will require a read-only SNMP profile to be assigned to the device, except for
SRV and OTHER, where it is optional.
Importing multiple devices in bulk
While you can go ahead and add one device at a time like this, it will quickly get tedious if you have more than a handful of devices to monitor. This is where the Bulk import function comes into the picture:
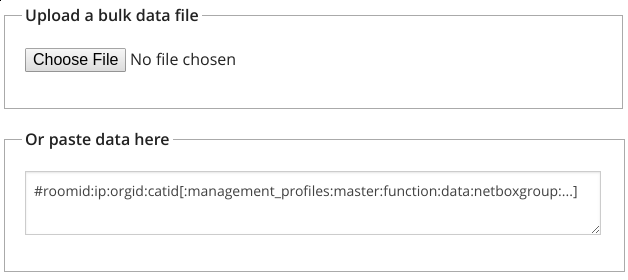
Assuming you have a readily available list of IP addresses to monitor, e.g. from your inventory system, you can create a comma (or colon) separated text file with the required details and upload or paste it into the bulk import form.
The format is pretty straightforward: The initial fields are required, while
the fields listed in square brackets are optional. Optional fields can be
omitted or left blank. A line beginning with a # sign will be regarded as a
comment and ignored. Thus, for adding some switch using the default SNMP
management profile you added earlier, and a function description of
Packet switching, this line would do it:
myroom:10.0.1.42:myorg:SW:Default SNMP v2c read-only profile::Packet switching
Click Preview import to have NAV validate your input. Each line will be displayed with a colored status dot. A green dot indicates the line was found OK and will be imported once you submit. A yellow or red dot indicates an error with the line; such a line will be ignored when you submit the preview form, unless you go back and fix it before submitting the form again.
Further reading
Now you know how to monitor things. It’s time to get organized!