Table of Contents
The status tool
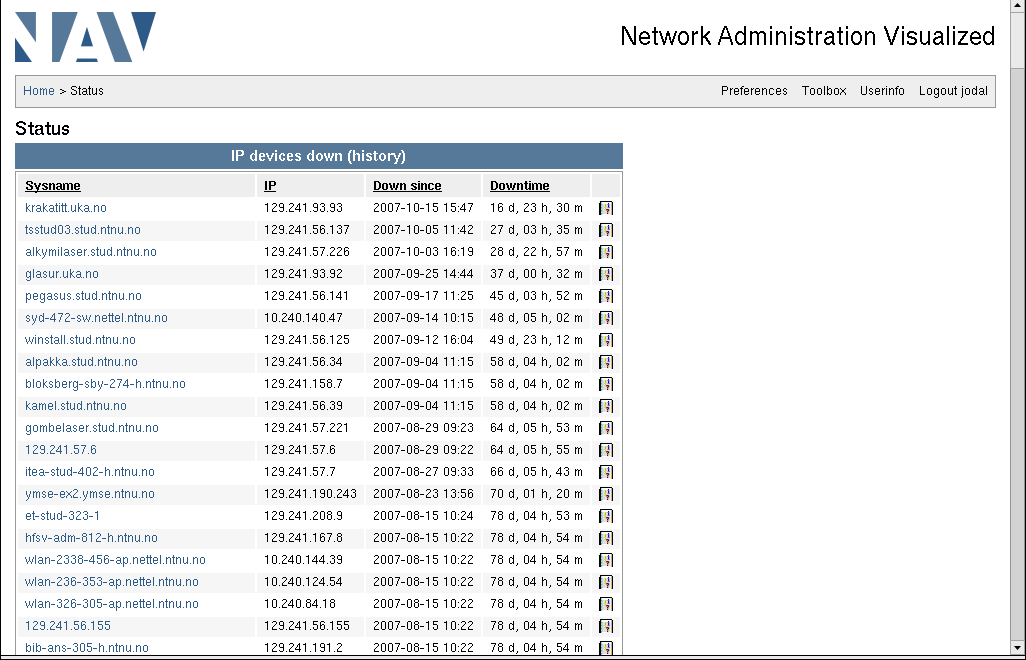
 The status tool gives an overview on operations; i.e. that all the network components and services are up and running.
Back-end processes
NAV has four background processes that monitors the operational status of the network. It is the events triggered from these monitors that are displayed in the status tool. The four monitors are:
- The status monitor (pping) monitors basic - but fundamentally important - reachability. Are all the devices alive or are some down?
Since NAV has knowledge of topology, root cause in a larger breakdown can also be pinpointed. NAV distinguishes between a device being down or a device being in shadow of a more central device that is down (it is actually the event engine that is responsible for this correlation). - The service monitor (servicemon) monitors services. A number of services are supported (ssh, http, ssl, imap, pop3, smtp, dns, rpc, samba, dc and more).
- The module monitor (modulemon within ipdevpoll) monitors the operations of modules within a switch stack or within a chassis.
- The threshold monitor (thresholdmon) monitors the RRD data and send alarms if a threshold on a given value is exceeded.
For more information on the event and alarm system, see here.
The status page
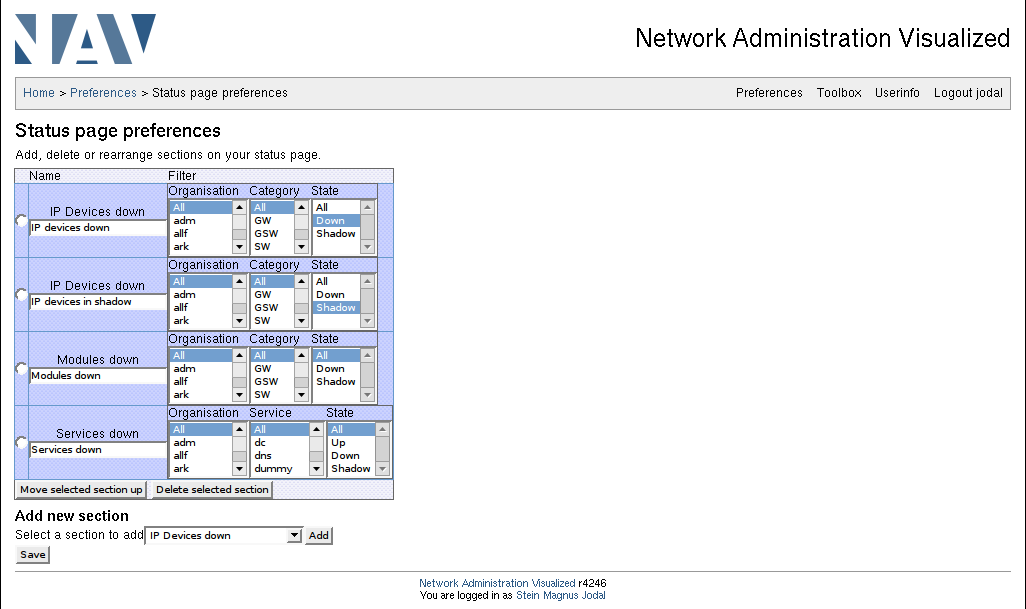
The status tool gives an overview of all the active alarms. The display is divided into several sections, this is per-user configurable using the preferences tool from the tool bar. The default sections include:
- IP devices down
- IP devices in shadow (shadow means that the device is behind a device that is down and the status is thus unknown)
- Modules down
- Services down
In addition using the preferences tool (reached from the NAV bar) you may add:
- Thresholds exceeded
- IP devices on maintenance
- Services on maintenance
For each section the NAV user may also choose to filter out certain alarms based on either organization, category (GW/GSW/SW/SRV etc) or state (up/down/shadow).
History
From each status page section a link to history is provided. You may also see individual histories using the link provided on each line in the listing. The history view goes per default 7 days back, but can be increased to a maximum of 30 days.
Service Matrix
For the services section you may in addition go to a matrix view that shows red and green lights for all monitored services.
Configuration files
For the webfront - none. But the data the status page shows is supplied from backend processes such as pping, servicemon, etc. They have configuration files that can alter their behavior, for details see backendprocesses.

