This is an old revision of the document!
Table of Contents
The threshold monitor
The threshold monitor in NAV 3 uses data from NAV's RRD database, and the RRD files generated by Cricket, to check for and report interfaces with high load, high CPU and related events. At the moment there is no interface to easily adjust the threshold values. However, this is under development.
Operation
ThresholdMon runs as a cron job. At run-time, it fetches all the thresholds in the RRD database and compares them to the datasource in the corresponding RRD file. If the threshold has been exceeded, it sends an event containing relevant information.
Filling thresholds
Threshold manager can be used to set alert-thresholds for data sources on specific interfaces, list all thresholds and bulk update thresholds.
It contains an advanced search for choosing netboxes and/or interfaces for bulk update.
It is possible to use both actual and percentage values,- and if an alert should be triggered if traffic-load is less or greater than the configured value. Percentage values are is supplied by entering a trailing percent character. Percentage values are only legal when a max-value is defined
List all thresholds
All threshold are listed by supplying the url /threshold/all/. Thresholds are grouped together by netbox-names.
To take a look at configured thresholds, click the plus-icon.
In this view all input-fields are editable,- and it is possible edit the values and save. To hide the detailed view, click on the minus-icon.
Set thresholds for interfaces
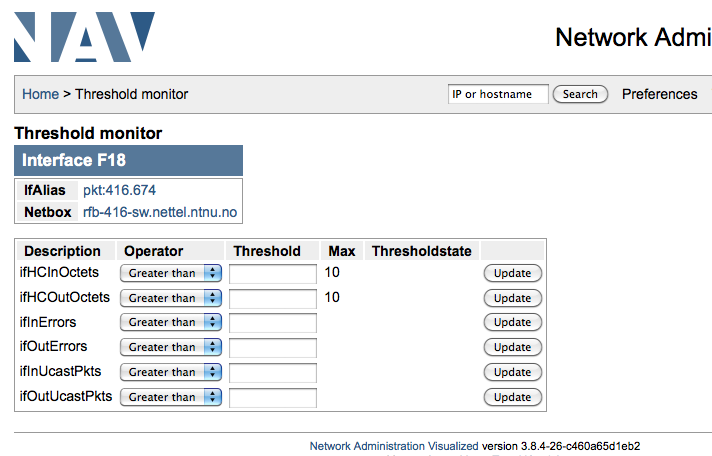
The interface is shown with all possible data-sources.
As you will notice it is possible to supply percentage values for ifHCInOctets and IfHCOutOctets because a max-value is defined,- while the rest must be actual values.
Bulk update thresholds
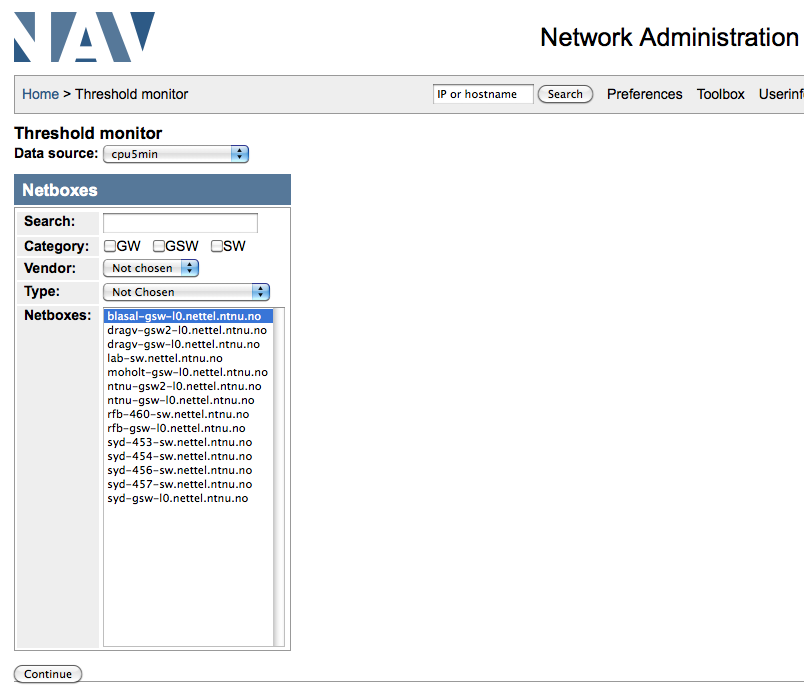
Bulk update is started by first selecting data-source. The reason for this is that some data-sources can only be applied to netboxes and some only to interfaces.
To set a threshold for cpu-load we could choose cpu5min and the corresponding netboxes that are able to supply this information are displayed.
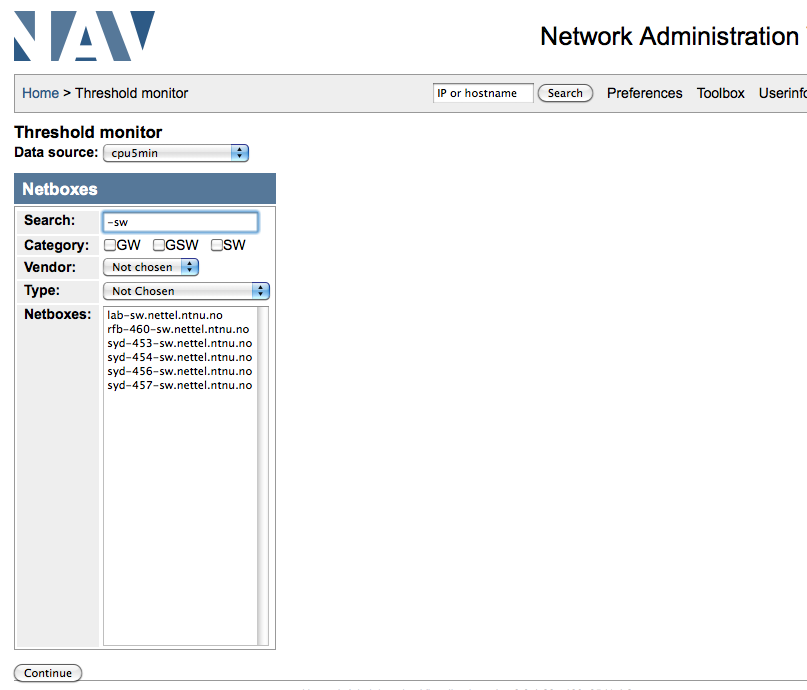
Further refinement for filtering out unwanted netboxes is possible by supplying systemname, category, vendor and type.
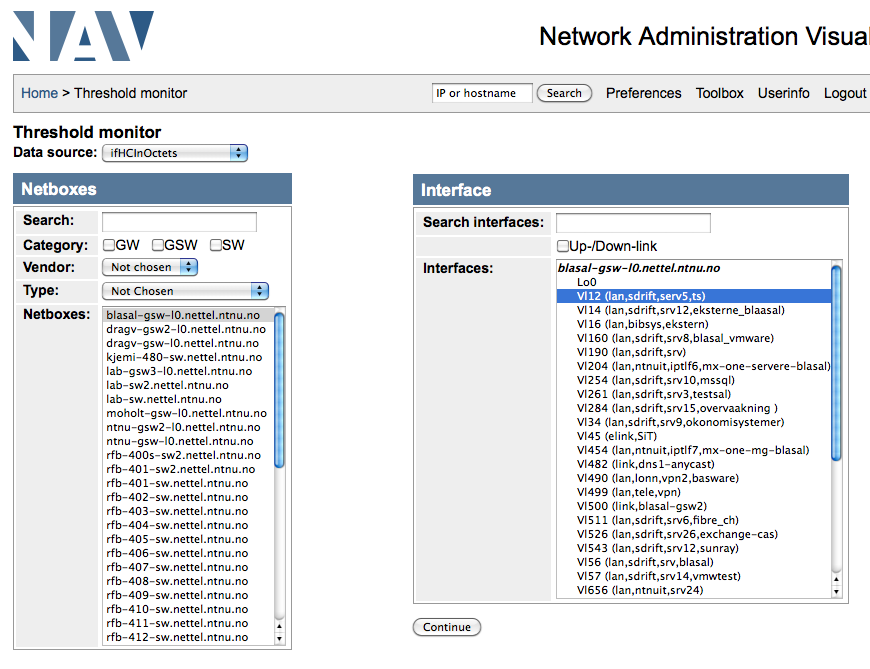
If you choose a data-source that applies to interfaces you will get 2 search boxes,- both for netboxes and interfaces.
By chosing netbox on the left only those interfaces that belongs to the chosen netbox will be displayed in the search-box for interfaces. In addition you are able to filter on interface-names and up- or down-links.
When you are satisfied with the search, select netboxes or interfaces and press Continue.
You are now able to to set threshold values for the given data-source on all the displayed netboxes or interfaces. You may select/deselect all by clicking on the checkbox in the upper left corner of the table or choose individually. Nothing is saved before you press Save checked or Save all. I believe you have got it now… ;)


