Table of Contents
Introduction
This document complements the NAVFeatures document. We here show a number of screenshots taken from running NAV version 3 installations (NTNU and UNINETT). Each screenshot is accompanied by text explaining the basic functionality. We do not go in detail, and not every aspect of NAV is covered.
Frontpage
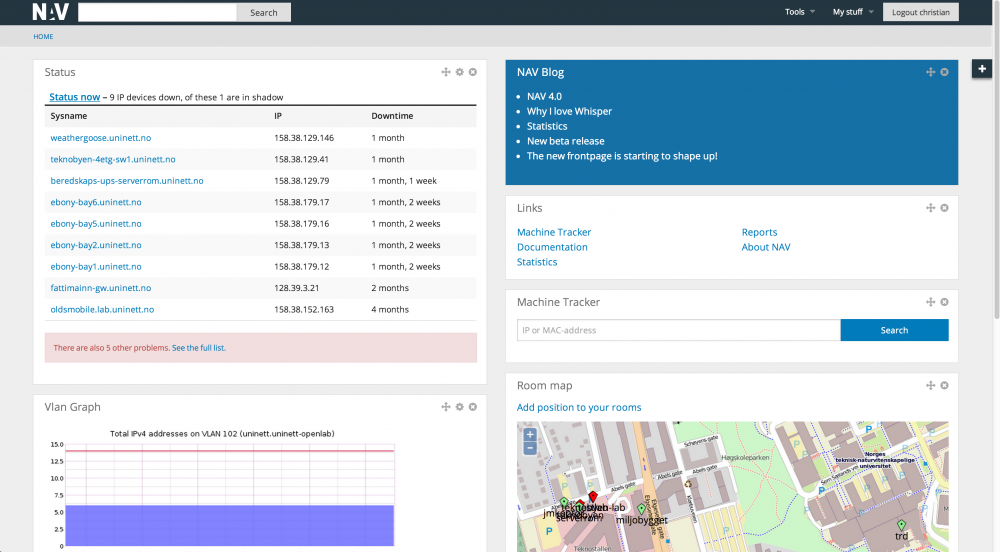
This is what the NAV main page looks like (the text is partly in Norwegian). In the example no alarms or messages are active, meaning operation is running fine:
The toolbox
Traffic maps
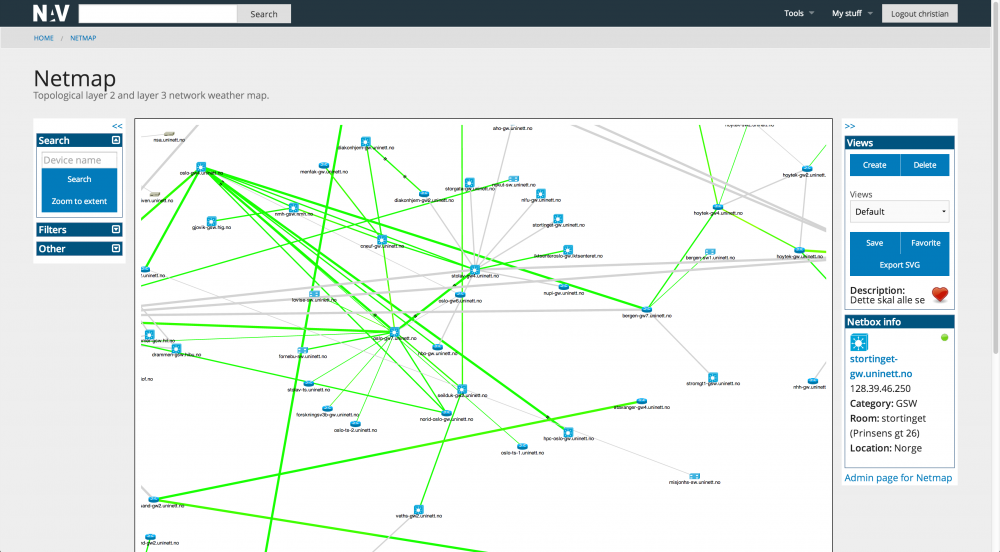
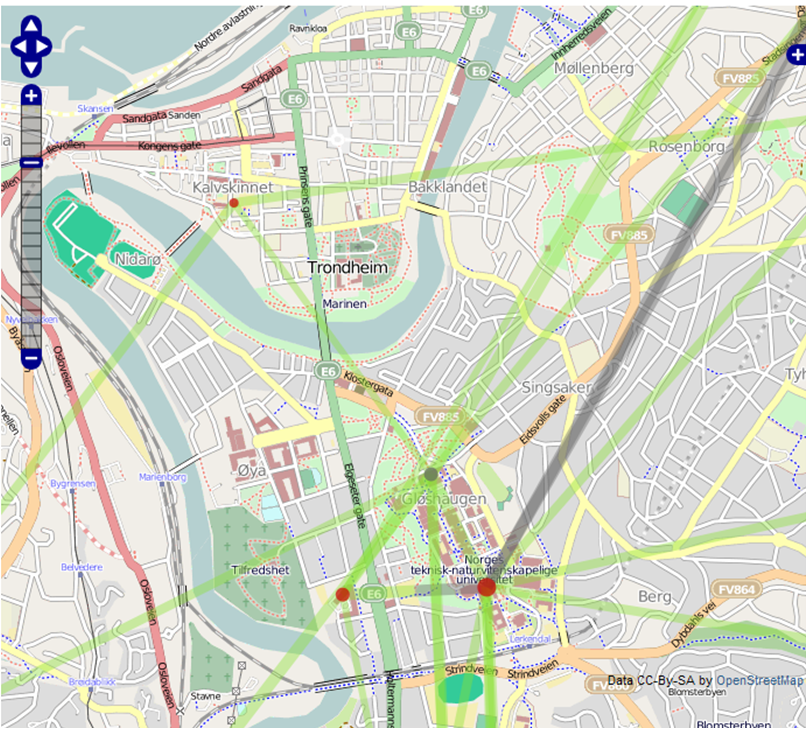
There are two traffic maps tools in NAV; Netmap and Geomap. More info will follow later.
Netmap
Geomap
The network explorer
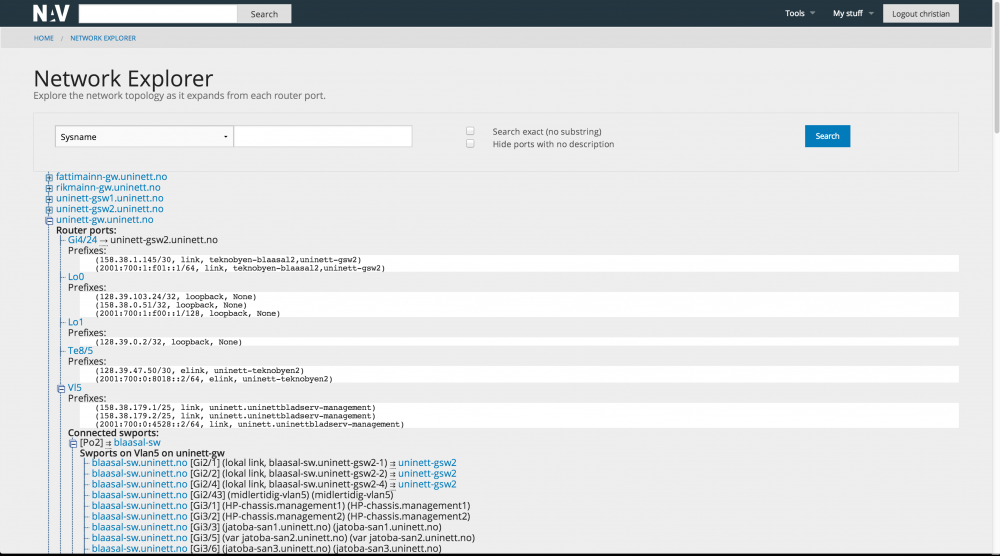
The network explorer complements the traffic map. It does not show load, nor does it show layer 3 topology, but it has a superior overview of the layer 2 network. You can explore the network by clicking on a router interface or switch port in interest and thus open a new branch to the tree. You may also search for a node in the network. You may do searches as well, for example for an entire vlan, or all equipment in a room/area and more.
The machine tracker
NAV has historic data on the whereabouts of all the machines (IP adresses / mac adresses) in the network. You can locate a machine down to the switchport the machine is directly attached to. The machine tracker tool allows you to search for the location of a given machine, or a set of machines. An example is given:
Traffic measurements

NAV does not collect traffic data itself, but depends on Cricket and RRD. NAV does however automate the process of generating the Cricket configuration tree, which is a tedious process to keep up to date in large (and ever changing) networks.
The data that by default are collected covers packet, octet and error counters on router interfaces and switch ports, cpu and memory data for routers and more. An example of the RRD data as shown by Cricket is given:
IP Device Info
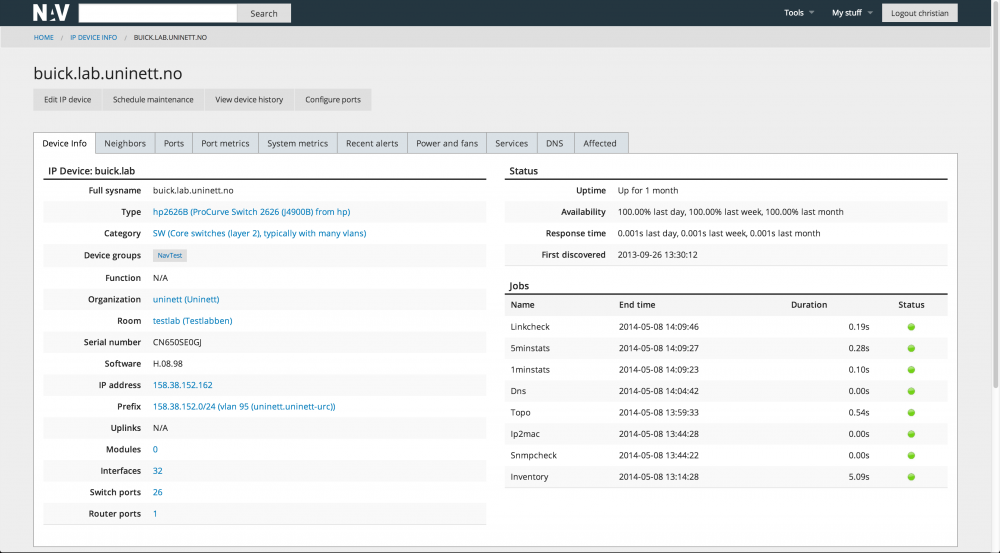
IP device info summarizes most of what NAV knows about a single IP device (or arbitrary IP address within your network) on a single page.
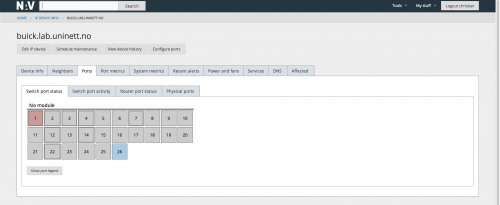
Switch ports and router ports on devices are displayed in a graphical fashion, grouped by modules.
Reports
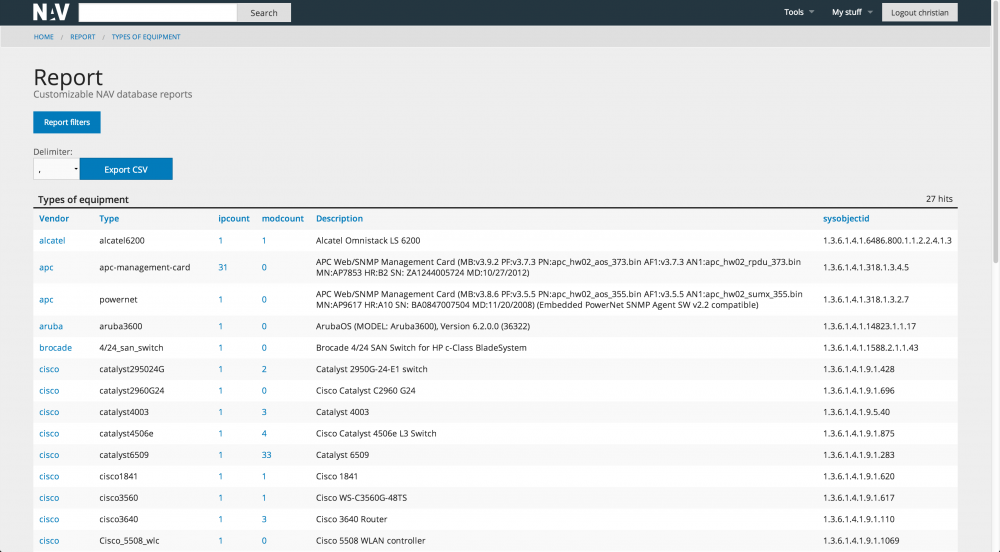
NAV has a number of reports (and with a little knowledge it is easy to make new reports). We give four report examples below.
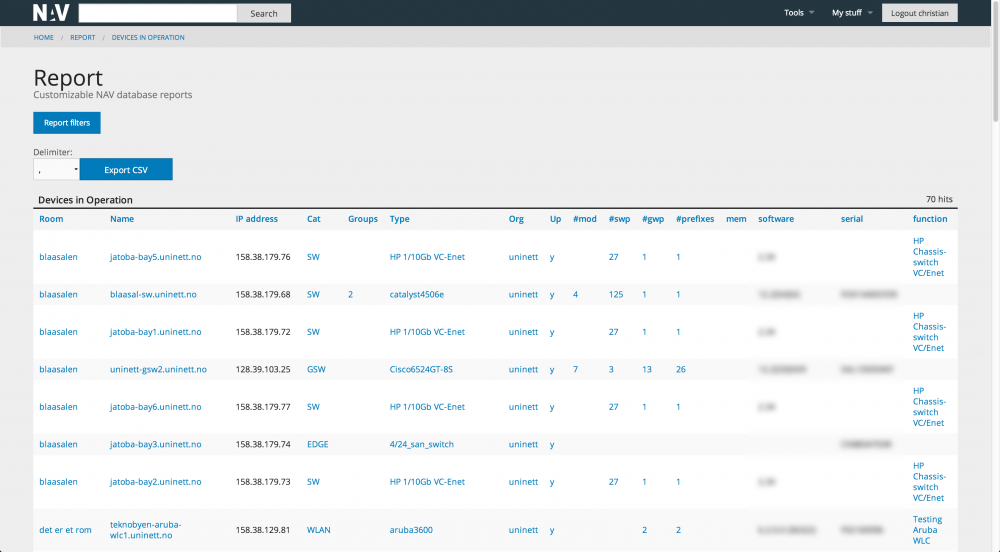
The first gives a good overview of all the network equipment in the network, i.e. the types of devices and the number of each. By following the links in the report you can drill down to new reports for further details.
The next example gives an overview of all routers, switches, servers, etc, that are managed by the NAV installation. The number of attached modules and ports are shown with the possibility to drill down for details.
The router interface report shows all connected interfaces with respecting adress scope and description. Note that static routes to external routers/firewalls are included.
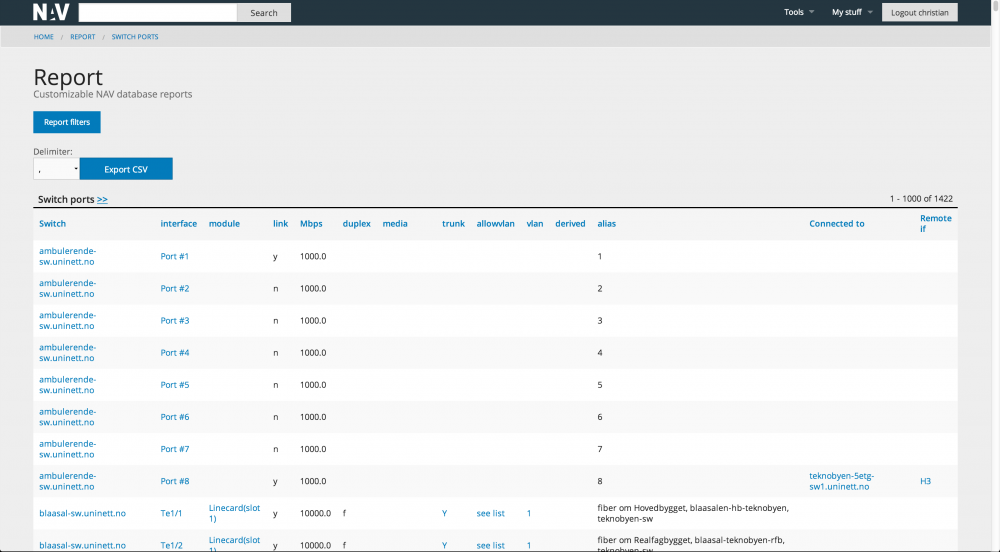
The switch port report gives data on link, speed, duplex, port name, vlan and trunk information. The report also shows what devices are connected to which switchports. By following the links you can hop to reports regarding the device in interest.
Subnet matrix
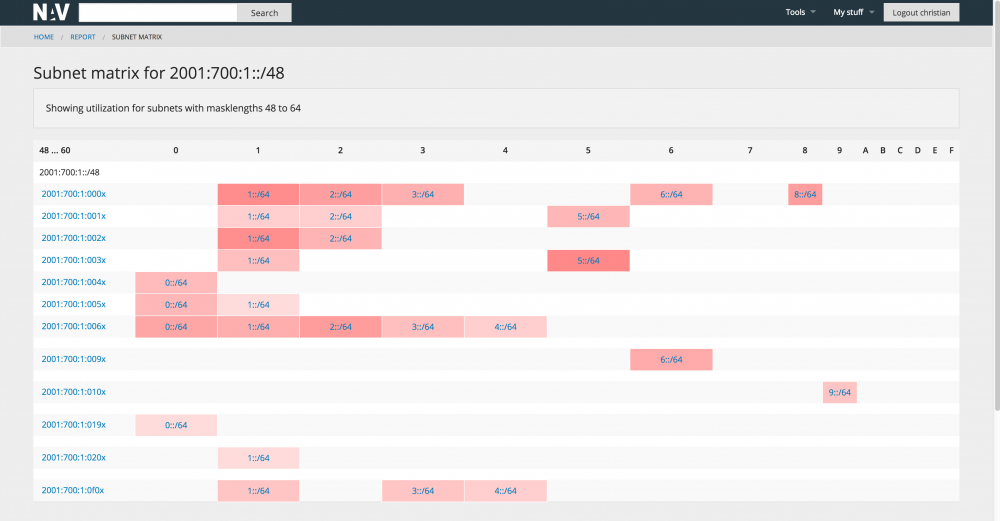
For large networks the task of maintaining the total IP address scope may be a challenge in itself. It is useful to have an overview of all the subnets in operation, and what's more, how full they are, i.e. how many machines do they contain. NAV introduces the subnet matrix that gives an excellent overview on a single page:
The status page
NAV has a number of background processes that monitors the operational status of the network:
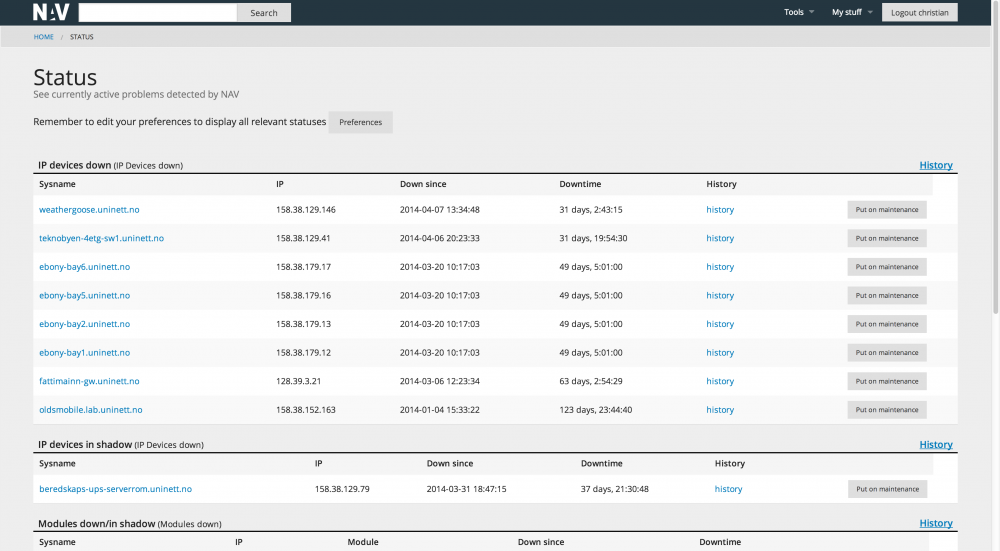
- The status monitor monitors basic (and fundamentally important) reachability. Are the devices alive? Since NAV has knowledge of topology, NAV can pinpoint root cause in the case of a larger breakdown. This is done by distinguishing between a device being down or a device being in shadow of a more central device that is down.
- The service monitor monitors services. A number of services are supported (ssh, http, ssl, imap, pop3, smtp, dns, rpc, samba, dc and more).
- The module monitor monitors the operations of modules within a switch stack or within a chassis.
- The threshold monitors the RRD data and send alarms if a threshold on a given value is exceeded.
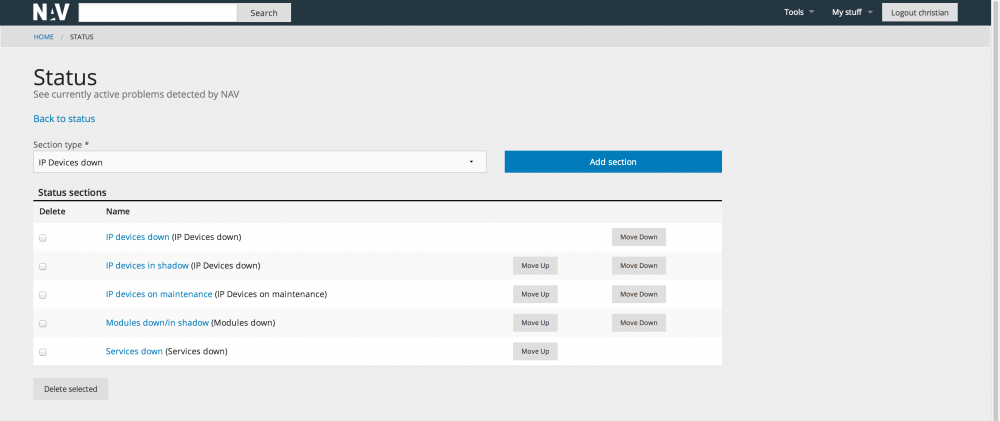
The status page gives an overview of all the active alarms. A historic view is also available.
Messages
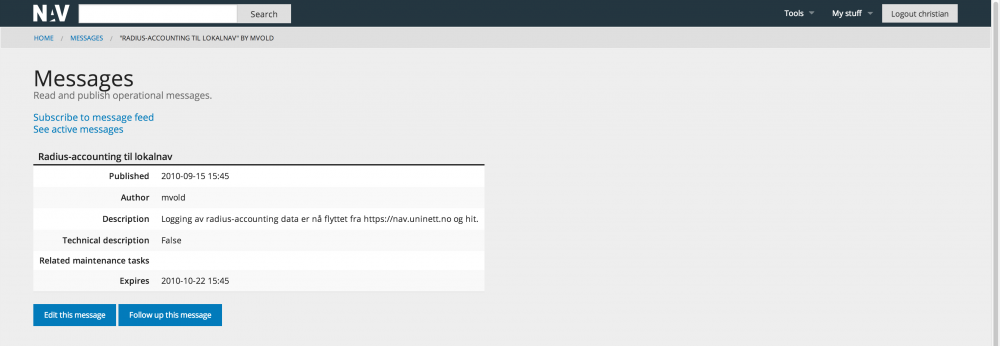
NAV includes a message system so that NAV operators can inform users about planned outages or unplanned disruptancies. The messages are posted on the home page of NAV along with the (head of the) status page. Thus the NAV home page is the place to go for an updated view of the operational status of IT operations!
The screen shot below shows an archived message:
Maintenance Tasks
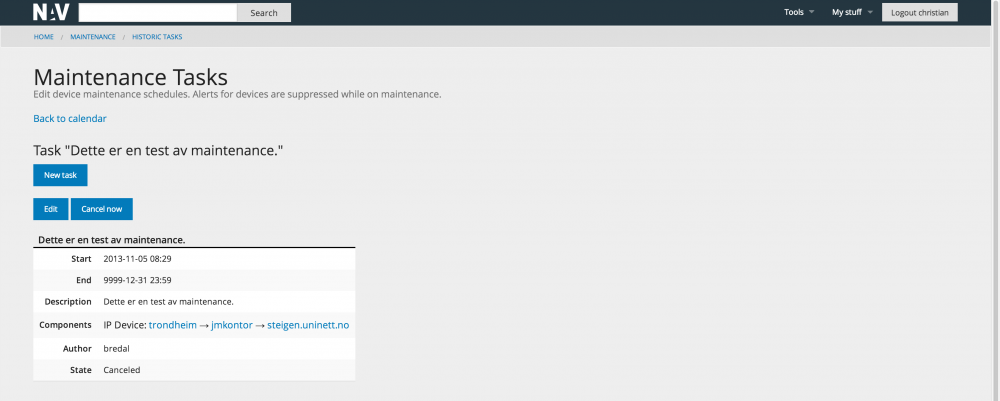
In the case of planned work NAV allows you to put equipment on maintenance for a given time period, meaning NAV will not send any alarms regarding the device.
The screen shot below shows an archived maintenance task:
Alert Profiles
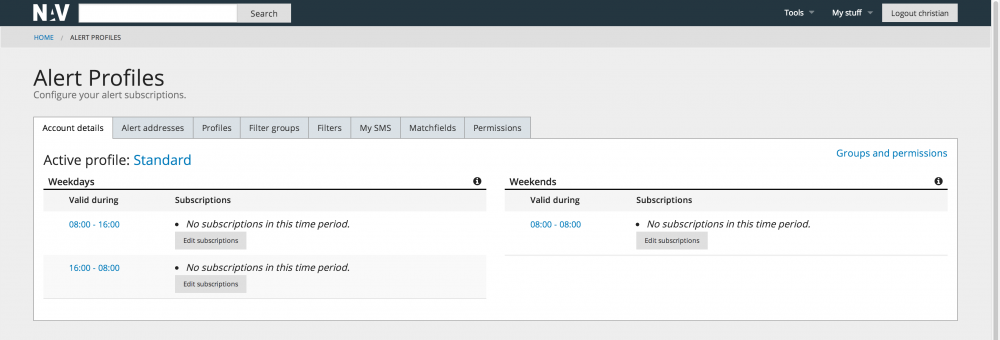
In addition to seeing the operational status on web NAV users may receive alarms on email or as SMS. The alert profiles tool lets gives the user finegrained control of how he would like to receive alarms of interest. Different profiles (at work, on guard, off duty etc) may be defined, each profile specifies which type of alarms the user is interested in on what alarm address.
Note that alarms from external systems may be sent to NAV and thus included in the alert profile setup.
Device History
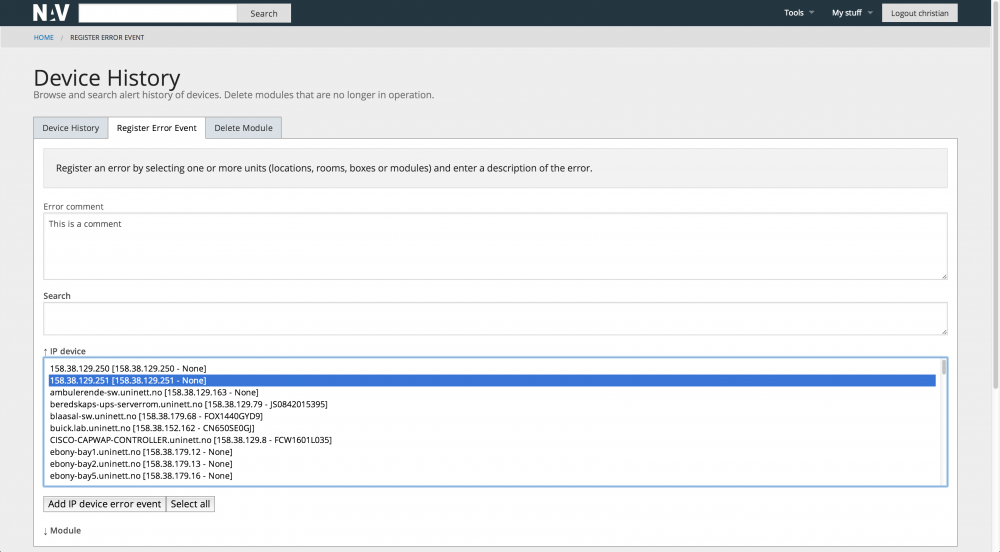
The device history tool has a focus on the physical network devices identified by their unique serial number (as opposed to the logical devices identified by IP addresses). The Device History tool lets you see the history of devices, register error events or delete outdated modules.
The example shows the tab for registering a particular error event:
We may for instance have repeating error occurrence for a device, where fixes are done by different staff. Device history then serves as a place to get the overall picture.
Seed Database
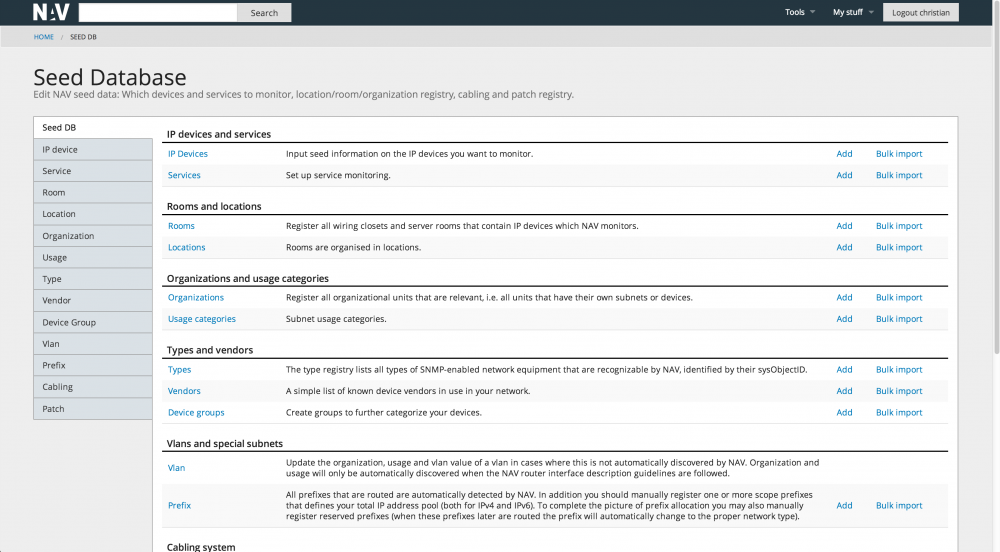
NAV does not fully autodiscover the network. You need to seed the database with key information, the most important being the IP address and SNMP community string of the devices you would like NAV to manage. The home page og the seed database tool looks like this:
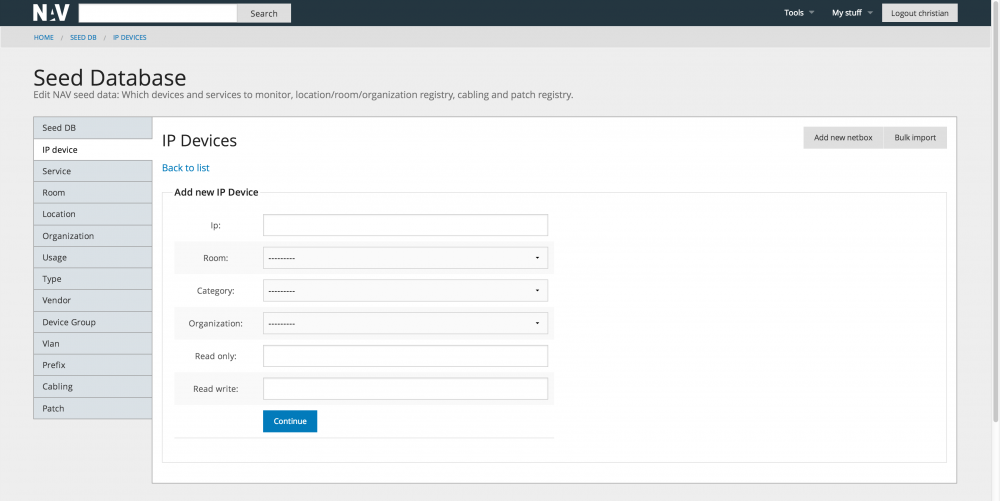
Below follows an example of the form used to add a new box (ip device) to NAV. Note that we allow bulk import of seed data from a text file format. This is useful if you have a large number of devices in your network.
Cisco syslog analyzer
If you like, you can set up your NAV machine with a syslog demaon that receives syslog data from your cisco routers and switches. NAV includes an analyzer that understands the semantics of cisco syslog messages. The messages are parsed and structured in a dedicated database. The syslog analyzer tool serves as a front end to this database and gives you a structured interface to all the collected syslog messages.
User administration and user preferences
The NAV administrator manages the NAV user account. He can add, delete or change the privileges of users, and set passwords. The users may change their own passwords. NAV also supports ldap lookups, i.e. passwords may be syncronized with an external ldap server.
NAV adopts a flexible system for authorization allowing for fine tuned control of what a given NAV user is allowed to see and do (authorization is not fully implemented in all NAV tools at the time of writing, but the framework is in place).
The user may also set his own preferences. He may for instance define his personal toolbar links and he can tune the information he would like to include on the status page:
