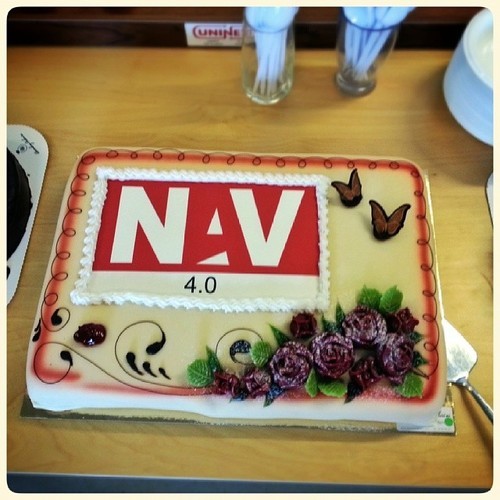
For those of you who still don’t know, these days we are working very hard to bring you NAV 4.0.
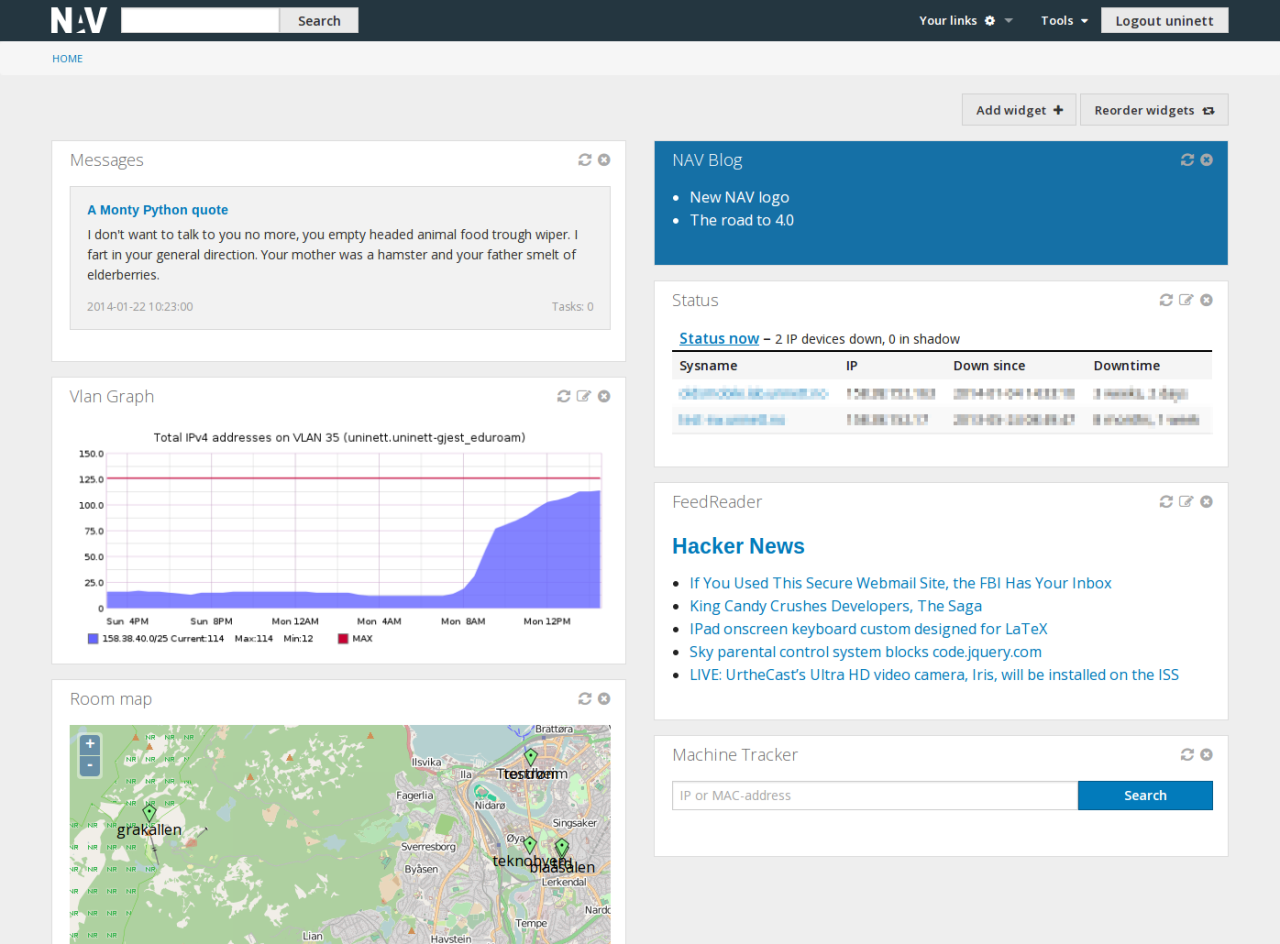
NAV 4.0 mostly tries to solve two big issues. One is an issue of mobile and small screen compatility (a.k.a grand ui redesign), the other is the long standing issue with lack of flexibility in storing and presenting time-series data (a.k.a statistics).
Mobile and small screen compatibility (A.K.A. Grand UI redesign)
While the initial goal came from a seemingly innocuous request from the NAV reference committee, to make some of the relevant NAV tools usable for field work on small screens, it has become so much more.
Our gut reaction was to “fix” the so called “relevant” tools piecemeal, but we eventually realized that this was the way we always did things, and that it was really an anti-pattern. Although we have worked towards extensive reuse of backend code in NAV, we have not been so diligent in encouraging reuse on the frontend side of things.
We did initially do some minor alterations to the status and the port admin tools to make them work better on small screens, and these were released in NAV 3.14. These were only a quick band-aid, though.
We came to see the need to redo much of the design of the NAV web interface to achieve a consistent user experience. Many of the NAV tools, while all inheriting from the basic NAV web template, would often times “re-invent the wheel” when it came to user interface elements. This only serves to confuse users, and is also a maintenance nightmare.
![[Foundation hero logo]](/image/blog/foundation-hero.svg) We wanted a framework to help us achieve this. Although Bootstrap was considered at first, it’s license was deemed incompatible with our use of version 2 of the GPL. Eventually we landed on Foundation as our framework. We also thought that while Bootstrap was nice for getting a new project up and running fast, we already had an old and big project, and it was in need of a framework that would help us structure and consolidate an already huge amount of design work.
We wanted a framework to help us achieve this. Although Bootstrap was considered at first, it’s license was deemed incompatible with our use of version 2 of the GPL. Eventually we landed on Foundation as our framework. We also thought that while Bootstrap was nice for getting a new project up and running fast, we already had an old and big project, and it was in need of a framework that would help us structure and consolidate an already huge amount of design work.
We were fortunate enough to acquire the help of Christine Sætre from NTNU. She works as an expert in the field of interaction design, and has been an invaluable part of our redesign feedback loop for several months already.
Not only are we cleaning up things on a large scale here, but in the process we are evaluating the usability of all the tools on small screens and touch devices, which was what we set out to enable in the first place.
Lack of flexibility in handling time-series data (A.K.A. Statistics)
NAV already has a long history, dating back to the nineties, having first acquired its current name in 1999.
Being something a lot smaller than it is today, it initially provided a way to automatically configure MRTG to collect and graph time-series data from monitored devices. Fairly quickly, it replaced MRTG with Cricket, and has been using that ever since.
The biggest selling point of Cricket was its hierarchical configuration trees, simplifying manual maintenance of configuration for monitoring massive numbers of devices. However, this point was really moot, all the while NAV would automatically produce and maintain this configuration for you.
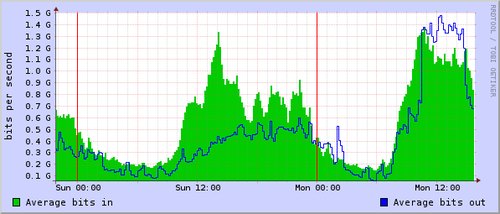
Over the years, Cricket would prove massively inflexible whenever we wanted to collect new things while still keeping old data around, or when we simply want to organize information differently. Most of these things were possible, of course, but would require huge amounts of manual work on the part of the NAV user/administrator.
Cricket would also scale poorly when increasing the number of things to be monitored. In fact, the entire reason the EDGE device category exists in NAV was NTNU’s wish to exclude statistics from access ports, as they simply could not get Cricket to scale to the massive amounts of edge switches in their network.
To underscore our growing dissatisfaction with Cricket, maintenance of its codebase seems to have ceased in 2004. How could we replace Cricket with something better?
![[RRDTool logo]](/image/blog/tumblr_inline_mzpfb8wwf21swzy6x.png)
We knew we wanted to do the data collection in NAV code. We already had a daemon for collecting SNMP data; why should we outsource parts of this a third party tool? Although RRDtool still seemed like the best candidate for storing our time-series data, part of our gripes with Cricket were actually with RRDtool itself.
That’s when we found Graphite.
We established an experimental Graphite installation and started sending metrics from our customers’ NAV deployment servers to it. During testing, other groups within UNINETT caught on on and established Graphite installations for new projects they were working on.
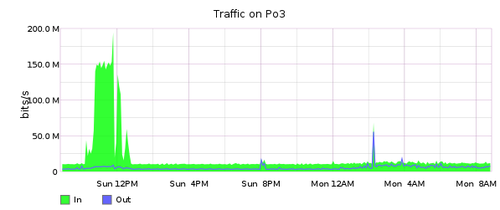
Eventually, the flexibility and scalability of Graphite, coupled with it’s simple interface for sending metrics, won us over. We decided it was our replacement for RRDtool and the Cricket web interface, while data collection would be handled by NAV’s existing SNMP collection engine, ipdevpoll.
A new major version
It’s been a full 10 years since the first NAV 3 release. While we have made many evolutionary changes to NAV these past ten years, the latest 3.15 release being quite different from the first 3.0 release, we believe these two changes to be fairly large and disruptive.
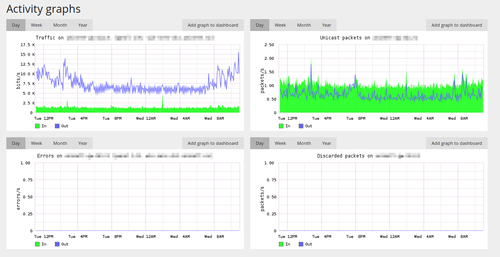
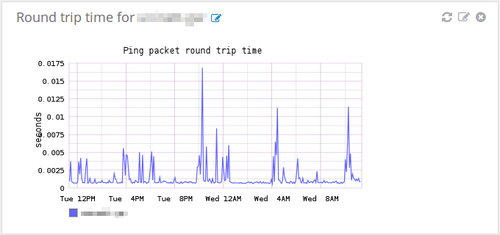
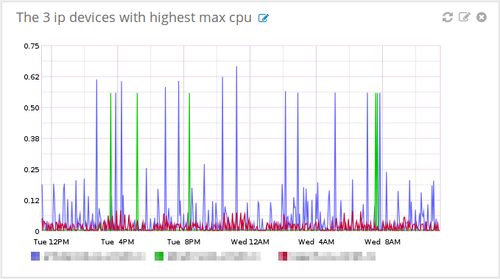
Even though most of the data was collected by a third party tool, statistics have been part of the core of NAV. This new version fundamentally changes this core, and you will feel the difference. NAV 4 no longer tracks the individual metrics that are available, but leaves that to Graphite. It sends metrics to Graphite and assumes it will find them there later. It doesn’t care how Graphite stores its metrics, it uses Graphite’s API to discover which metrics are available, to graph the metrics, and leverages the API when defining and monitoring metric threshold rules.
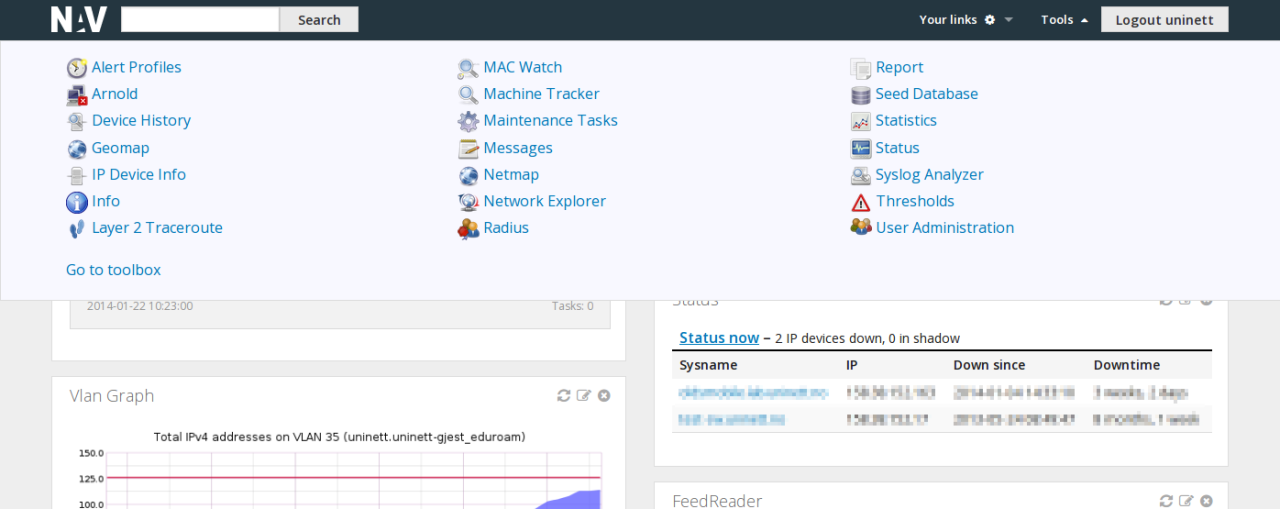
While the core functionality is the same, you will be met by an entirely redecorated user interface.
It will feel quite different, but hopefully a lot better, than the NAV you know, and that is what we want to signify by increasing the major version number.
Welcome to NAV 4!
P.S. We will be back with a blog entry on beta testing NAV 4, so stay tuned :-)

![[Foundation hero logo]](/image/blog/foundation-hero.svg) We wanted a framework to help us achieve this. Although
We wanted a framework to help us achieve this. Although 
![[RRDTool logo]](/image/blog/tumblr_inline_mzpfb8wwf21swzy6x.png)
