Gaps in Graphite graphs
If you have gaps in your graphs the reason may be small buffer sizes. Read how to detect and fix this problem.
The sixth maintenance release of the NAV 4.2 series is now available.
The source code is available for download at Launchpad. A new package for Debian Wheezy has been published in our APT repository, as usual.
Debian Jessie (the next stable release of Debian) is scheduled for release on Saturday 25th April, so we will start working on building a package for Jessie as well.
The following 11 reported issues have been fixed:
Bugfixes:
Happy NAVing everyone!
The fifth maintenance release of the NAV 4.2 series is now available.
This replaces the 4.2.4 release, which broke the parallel pinger, and possibly other event-posting components. Again, to those who already upgraded to 4.2.4, we apologize for the inconvenience. More details at the bug report here:
https://bugs.launchpad.net/nav/+bug/1434520
The source code is available for download at Launchpad. A new package for Debian Wheezy has been published in our APT repository, as usual.
Happy NAVing everyone!
The third maintenance release of the NAV 4.2 series is now available.
The source code is available for download at Launchpad. A new package for Debian Wheezy has been published in our APT repository, as usual.
Happy NAVing everyone!
The second maintenance release of the NAV 4.2 series is now available.
The source code is available for download at Launchpad. A new package for Debian Wheezy has been published in our APT repository, as usual.
Important note:
This release adds commas to the list of characters escaped in Graphite metric names, which may change the name used for some of your existing metrics after an upgrade. If you want to keep your data, the underlying files need to be renamed manually in your Graphite installation. See the updated release notes for more details.
The following 23 reported issues have been fixed:
Happy NAVing everyone!
NAV 4.0 has now been widely deployed, and people are enjoying the fresh layout, improved interface and (not really enjoying) new bugs. The feedback has been very good, but some issues have been raised.
Graphite and it’s data-accepting sidekick Carbon have been creating some trouble for new and old NAV users. We have tried to help those with problems, but still have some issues that have not been resolved. This is kind of expected when introducing a new element for such a critical part of NAV, but we are working hard to fix the remaining issues.
We have seen an increased interest in NAV after the release of 4.0. That is something we are very happy about. We would like to remind you that to communicate with other NAV users and developers, you can use IRC (channel #nav on irc.freenode.net) or email nav-users@uninett.no.
In addition to fixing bugs we have been working on new functionality for the NAV 4.1 release which is scheduled for release in late May.
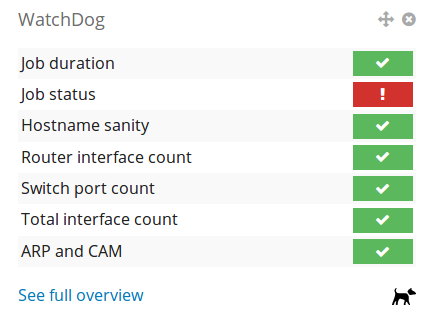
The most visible addition is WatchDog. WatchDog tries to give you an indication about the health of your NAV installation. It runs tests for known problems to see if everything is as it should be, and displays this information in a widget. WatchDog also has its own page displaying its status, as well as interesting general information about your NAV installation.
We have also been working on the Subnet Matrix report to make it able to display smaller subnets for a more complete overview of the prefix usage on your network.
Lastly we have been working on getting rid of the optional fields available in rooms and organizations. These fields will be replaced with a much more flexible solution where you can have as many or few fields with custom information as you want. And yes, the old values will be copied to the new solution.
That is all for now. As always, feel free to contact us by email nav-users@uninett.no for general inquires or nav-support@uninett.no for support related issues. We are also available on IRC channel #nav on irc.freenode.net.
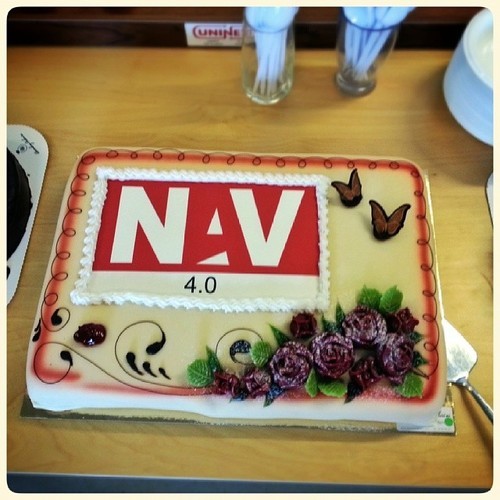
For those of you who have not already noticed, we released the final NAV 4.0 version less than two weeks ago. Due to a serious bug found on the 3.15 branch, 4.0.1 was also released last week.
We also celebrated with cake!
As before, the most convenient way of getting started with NAV is using Debian GNU/Linux and the packages from our APT repository. If you aren’t already up and running with NAV, see our guide for adding the repository to your Debian server.
We realize that Graphite’s documentation may not be the best, and we are already receiving question about installing and configuring both the Carbon backend and the web frontend. Since we are a bit Debian focused, we have published a guide for installing and configuring Graphite for NAV use on a Debian server on our wiki.
As always, happy NAVing!
We have just built a new, modern server room at UNINETT, with robust power distribution and cooling systems, and of course, we want to monitor the server room environment using NAV.
For NAV, we are brushing up its support for collecting sensor readings from UPSes, and we are implementing support for the Comet web probes that have been deployed to take temperature readings in the new server room.
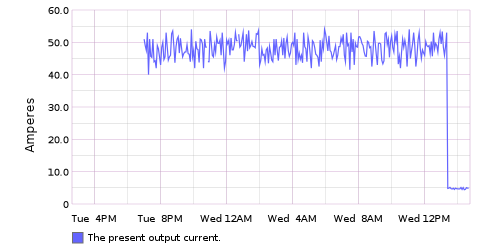
This is when I happened upon NAV’s implementation of the UPS-MIB (RFC 1628), where the precision of a couple of objects is off by a factor of 10. No way our UPS is putting out 50 Amperes of electric current! The fix for the NAV code was quick, but the graph doesn’t look very nice after the change:

This is where Whisper, the storage format used by Graphite, shines, compared to RRD, in my humble opinion. This was all fixable with some one-line command trickery:
whisper-fetch.py upsOutputCurrent.wsp \
| perl -lane \
'print @F[0] . ":" . @F[1]/10.0 if @F[1] > 15.0' \
| xargs whisper-update.py upsOutputCurrent.wsp
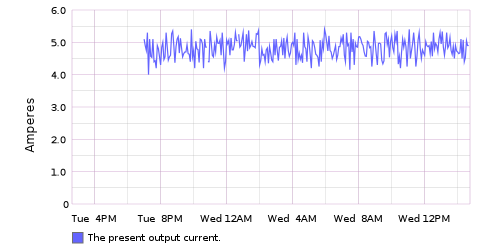
The result:

Brilliantly simple :-)
One of the goals we had when we moved from Cricket to Graphite for statistics was to integrate the graphs more with NAV, instead of having to navigate to another webpage to get the information you wanted.
For most NAV users, graphs are a very important source of information, and it is important that they are available where needed and configurable to convey the correct information.
The main source of graphs for an ip device is now the IP Device Info tool. For an IP device there are two types of graphs available - System metrics and Port metrics.
System metrics display graphs regarding cpu, memory and other system related metrics.

Port metrics display graphs regarding the interfaces of the IP device.

The detailed interface view display all related graphs for that interface in addition to detailed information regarding the interface.

Each graph has individual controls for choosing timeframe. In addition there are global controls available for selecting timeframes for all graphs on a page.
If the graph you are looking at is of special importance you can easily put it on your dashboard by clicking the “Add to dashboard” button. When the graph is on the dashboard you can set a custom title and refresh interval for it.

If you want to dive deeper and get even more out of the integration, you have the ability to create your own graphs using the Graphite interface. These graphs may then be placed on your dashboard and will refresh themselves automatically.

If you want to see and try all this out for yourself, we recommend installing the NAV appliance.
A new beta of NAV 4.0 is released. In addition to the new logo, you will also find interface improvements all over.
Try it out! It’s easy using the virtual appliance.